This web page was produced as an assignment for Genetics 564, an undergraduate course at UW-Madison.
What is phylogeny?
Phylogeny is the history of all species as they change through time (1). Phylogeny is typically expressed by a phylogenetic tree which shows how a group of species are related, whether they are closely related or have diverged from each other a long time ago. Species that share the same branch on a tree are more closely related than those that are on separate branches of a tree. For example in the tree shown in Figure 1, the human and the chimp FLNB genes are more closely related than the chimp and the rhesus monkey. The chimp and the human share a common ancestor with a rhesus monkey (this is noted by the node or the black dot) and you can see that it was sometime when this occurred in relation to the FLNB gene. Thus you can see how all species on earth are all eventually connected together, for we all share one common ancestor.
What is the phylogeny of the FLNB gene?
The phylogenetic trees of the FLNB gene were created by imputing a FASTA formatted text file (below) of all homologous FLNB DNA sequences from the several species shown into Clustal Omega and Muscle. After the sequences were run through the databases, the phylogenetic tree was calculated to either Average Distance % Identity (Figure 3) or Neighbor Joining % Identity (Figure 4) as well as calculated with BLOSUM62 (Figure 1 and 2). The differences between Average Distance % Identity and Neighbor Joining % Identity is that Neighbor Joining % Identity analyzes the sequences to find a tree with the shortest branch lengths, where as Average Distance uses averages to create the clusters seen and then extends them to form a tree (2). The difference between Percent Identity and BLOSUM62 is that percentage identity uses a percentage between sequences at each aligned position by taking the "number of equivalent aligned non-gap symbols X 100 / smallest number of non-gap
positions in either of both sequences", where as BLOSUM62 matrix utilizes the sum of the BLOSUM62 score alignments for evolutionary divergent sequences. I attempted to create other phylogenetic trees using T-Coffee, Phylogeny.fr and TreeFam but my DNA sequences we too large to do so.
These phylogenetic trees tell us what species are most closely related by their specific gene sequence found, discussed under FLNB Gene Homology, and which are less related. Each of the trees also shows us which species the FLNB gene underwent a change first, second and so on through the evolution of time.
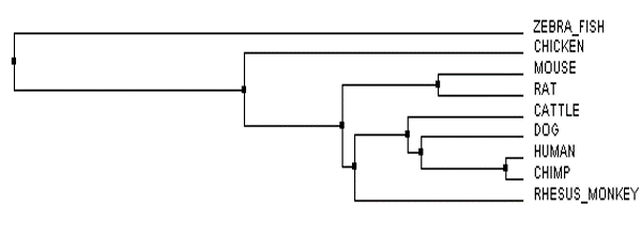
Figure 1: Clustal Omega and Muscle Average Distance BLOSUM62 phylogenetic tree of homologous DNA gene sequences of FLNB amongst several species.
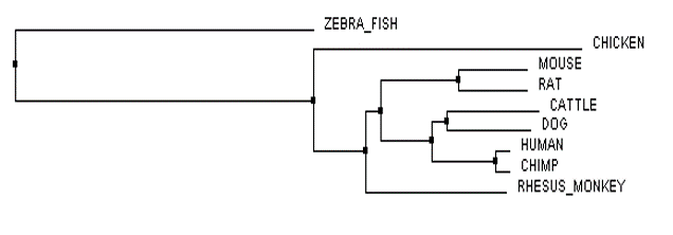
Figure 2: Clustal Omega and Muscle Neighbor Joining BLOSUM62 phylogenetic tree of homologous DNA gene sequences of FLNB amongst several species.
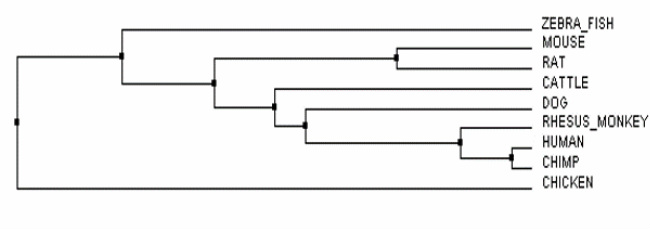
Figure 3: Clustal Omega and Muscle Average Distance % Identity phylogenetic tree of homologous DNA gene sequences of FLNB amongst several species.
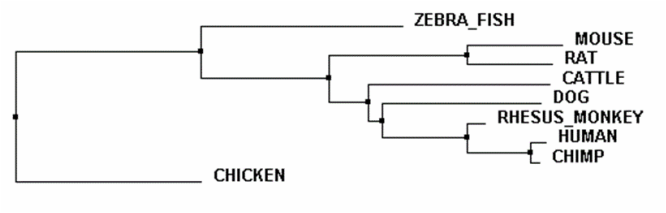
Figure 4: Clustal Omega and Muscle Neighbor Joining % Identity phylogenetic tree of homologous DNA gene sequences of FLNB amongst several species.
Analysis of the FLNB gene phylogeny:
After examining the resulting FLNB gene phylogenetic trees, I was able to notice a few differences that stood out a well as similarities between the different calculated phylogenic trees. Between all four trees (Figures 1-4) the mammalian species are all grouped together and share a common ancestor closer than those of non-mammalian species when it comes to their relatedness in the FLNB gene. This is a pattern that I am seeing and is probably because more research has been done looking at the FLNB gene in mammalian species than non-mammalian, or the FLNB gene could possibly have another role in non-mammalian species not associated with bone and cartilage development. There are also differences in the arrangement of species relatedness when comparing the BLOSUM62 calculated trees to the percent identity trees. This is because they each arrange the species to a specific set of characteristics explained earlier.
| FLNB Gene Phylogeny FASTA .pdf |
References:
1.) "Tree of Life Web Project: What is Phylogeny." Web. Feb, 20, 2014. http://tolweb.org/tree/learn/concepts/whatisphylogeny.html
2.) "Calculation of trees from alignments." Web. Feb, 20, 2014. http://www.jalview.org/help/html/calculations/tree.html
2.) "Calculation of trees from alignments." Web. Feb, 20, 2014. http://www.jalview.org/help/html/calculations/tree.html
